Net price index
The net price index follows the evolution of consumer prices excluding taxes and duties. Contracts, rents and other prices are often adjusted based on the net price index.
Selected statistics on Net price index
Calculating percentage increase?
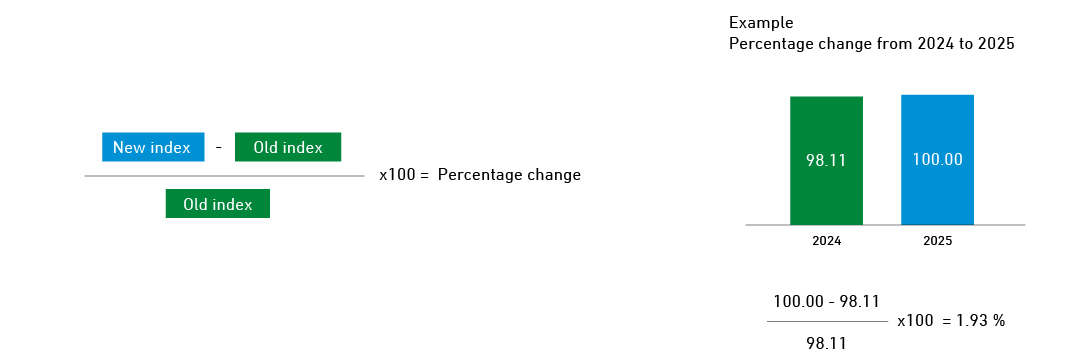
Calculating percentage increase from year to year (instead of month to month)? Use table PRIS05
Annual change in the net price index
The index of net retail prices is calculated on the basis of 23,000 prices collected from approx. 1,600 shops, companies and institutions throughout Denmark. The prices are collected by questionnaires or by means of price collectors who visit the individual shops. Prices on food and beverages and household items are to a large extent covered by the use of scanner data from supermarket chains. Prices are also obtained via the internet. Most prices are by far collected monthly. For goods and services, where prices typically change less frequently, prices are collected more rarely, for instance quarterly or biannually. The index weights for the detailed indices (elementary aggregate indices) are calculated on the basis of data from the national accounts on final consumption expenditure of households, supplemented by detailed information from the Household Budget Survey. Information from The Danish Ministry of Taxation on indirect taxes and duties is also used in the calculation of the Net Price Index.
Change in annual average of the net price index
The graph shows the percentage change in the yearly average of the net price index compared to the previous year and goes back 20 years.
The index of net retail prices is calculated on the basis of 23,000 prices collected from approx. 1,600 shops, companies and institutions throughout Denmark. The prices are collected by questionnaires or by means of price collectors who visit the individual shops. Prices on food and beverages and household items are to a large extent covered by the use of scanner data from supermarket chains. Prices are also obtained via the internet. Most prices are by far collected monthly. For goods and services, where prices typically change less frequently, prices are collected more rarely, for instance quarterly or biannually. The index weights for the detailed indices (elementary aggregate indices) are calculated on the basis of data from the national accounts on final consumption expenditure of households, supplemented by detailed information from the Household Budget Survey. Information from The Danish Ministry of Taxation on indirect taxes and duties is also used in the calculation of the Net Price Index.
On the statistics – documentation, sources and method
See the documentation of statistics to learn more:
The purpose of the net price index is to measure the development of the prices, less indirect taxes and duties and including price subsidies, charged to consumers for goods and services bought by private households in Denmark. The index of net retail prices has been calculated since 1980, but there are estimated figures for the development in net prices back to February 1975. The weights were last adjusted in connection with calculating the index for January 2014 and are based on private consumption expenditure in 2012.