
Producer and import price index for commodities
What are the trends in the producers’ sales prices and the importers’ purchase prices? How have prices developed for selected commodity groups, such as iron and steel, wood or plastics? The Producer price index (home market + exports), Import price index and Producer price index for domestic supply of commodities (home market + imports) show the price trend of commodities at the first stage. The primary purpose of the indices is to be deflators enabling the measurement of the real-economic development of the Danish economy. In addition to that, they are used as key economic indicators and for contract adjustments in the corporate sector.
Explainer on…
The sales price of products at the first stage of distribution, which typically involves the sale of goods from the producer to other businesses. In the Producer Price Index, the relevant price is the basic price, which excludes VAT and other deductible taxes related to turnover. Taxes and duties on goods and services invoiced by the company, are also excluded, whereas any product-related subsidies and discounts are included.
The price of domestically produced goods sold on the domestic market, measured at the producer level as producers' actual selling prices, in some cases internal transfer prices, excluding all taxes and duties, but including discounts and subsidies at the product level.
The price of domestically produced goods sold for export, measured at the producer level as producers' actual selling prices, in some cases internal transfer prices, f.o.b. (Free on board), excluding all taxes and duties, but including discounts and subsidies at the product level.
The price of imported goods, measured as importers' actual purchase prices, in some cases internal transfer prices, c.i.f. (Cost, Insurance and Freight), excluding all taxes and duties.
Selected statistics on Producer and import price index for commodities
Price development in the aggregate producer and import price index for commodities
Approximately 7,400 prices are collected each month. Of these, approximately 3,800 prices are used for calculating the Producer Price Index for Commodities and approximately 3600 for calculating the Import Price Index for Commodities and approximately 5,900 prices to calculate the Domestic Supply Price Index.
The sample of approximately 7,400 prices are distributed over approximately 1100 item groups. These product groups are selected so that they cover a minimum of 70 percent of the total turnover value for the target population. Within each of these product groups, the largest companies are selected (top-down), based on revenue value. By selecting the largest companies within a given product group, it is assumed that as per basic market theory these larger companies, as price influencers, have both a large direct share or transactions but also an even larger indirect representativeness which helps to ensure a representative sample for the entire product group. Each of these companies is requested to select their most representative commodities, i.e. those products that most represent their sales and/or purchasing behavior within a given product group. In order to match the sales balances in the national accounts, only prices are collected from companies that have production or import value within the specific product groups.
Each selected company is determined by their legal entity registration. In Denmark's Statistics Business Statistical Register, the legal entities are determined by their CVR number. In cases where a company has multiple CVR numbers sharing the same activity these can be combined into one unit from which prices are collected, for example, franchises. The companies must, as far as possible, report the price in force on the 15th of the month. If no price information is available for the 15th of the month, an appropriate day earlier in the month or an average of the prices for the first 15 days of the month can be utilized. For industries or products with high variation within the month – an average price for the whole month is instead preferred.
In order to meet the EU's requirements of actuality the index will from 2025 be using weights that are a maximum of 3 year old at the time of implementation from the Preliminary National Accounts. This means that the weights implemented in 2025 will be from 2022. However, the Preliminary National Accounts have a lower level of detail, which is why it is only possible to obtain the aggregate weight basis for 2022. In order to be able to calculate the individual goods' shares of the weight, we use the weight distributions from 2021 from the Final National Accounts. These are available at a very detailed level, which enables the distribution of weights on the individual goods. This means that the weight base for 2025 is 3 years old, while the weight distribution between goods is 4 years old. These weights covers the main part of all trading in the first turnover stage in Denmark, within the delimitation of the purpose of the statistics. Companies under a defined size are not included in the national accounts of the national accounts.
Producer and import price index for commodities
| Index | Percentage change compared to previous month (per cent) | Percentage change compared to same month the year before (per cent) | |
|---|---|---|---|
| 2026M08 | |||
| Total Danish production | |||
| Mining and quarrying, manufacturing, elecricity and water supply | 151.2 | 2.0 | 8.5 |
| Mining and quarrying and manufacturing | 138.7 | 1.1 | 6.7 |
| Mining and quarrying | 236.9 | 5.9 | 29.5 |
| Manufacturing | 132.7 | 1.0 | 6.3 |
| Electricity, gas, steam and air conditioning supply | 188.6 | 17.2 | 48.7 |
| Water supply; sewerage, waste management and remediation activities | 120.7 | 0.0 | 2.2 |
| Domestic market | |||
| Mining and quarrying, manufacturing, elecricity and water supply | 162.7 | 3.0 | 11.2 |
| Mining and quarrying and manufacturing | 140.8 | 1.4 | 7.6 |
| Mining and quarrying | 283.5 | 7.2 | 31.9 |
| Manufacturing | 126.3 | 1.0 | 6.0 |
| Electricity, gas, steam and air conditioning supply | .. | .. | .. |
| Water supply; sewerage, waste management and remediation activities | .. | .. | .. |
| Non-domestic market | |||
| Mining and quarrying, manufacturing, elecricity and water supply | 139.9 | 1.5 | 8.2 |
| Mining and quarrying and manufacturing | 135.3 | 1.0 | 7.4 |
| Mining and quarrying | 127.8 | 1.4 | 21.9 |
| Manufacturing | 135.3 | 1.0 | 7.4 |
| Electricity, gas, steam and air conditioning supply | .. | .. | .. |
| Water supply; sewerage, waste management and remediation activities | .. | .. | .. |
| Import | |||
| Mining and quarrying, manufacturing, elecricity and water supply | 124.6 | 1.1 | 7.3 |
| Mining and quarrying and manufacturing | 122.5 | 0.7 | 6.5 |
| Mining and quarrying | 148.0 | 8.3 | 31.7 |
| Manufacturing | 121.5 | 0.3 | 5.4 |
| Electricity, gas, steam and air conditioning supply | 64.8 | 23.9 | 60.0 |
| Water supply; sewerage, waste management and remediation activities | .. | .. | .. |

Approximately 7,400 prices are collected each month. Of these, approximately 3,800 prices are used for calculating the Producer Price Index for Commodities and approximately 3600 for calculating the Import Price Index for Commodities and approximately 5,900 prices to calculate the Domestic Supply Price Index.
The sample of approximately 7,400 prices are distributed over approximately 1100 item groups. These product groups are selected so that they cover a minimum of 70 percent of the total turnover value for the target population. Within each of these product groups, the largest companies are selected (top-down), based on revenue value. By selecting the largest companies within a given product group, it is assumed that as per basic market theory these larger companies, as price influencers, have both a large direct share or transactions but also an even larger indirect representativeness which helps to ensure a representative sample for the entire product group. Each of these companies is requested to select their most representative commodities, i.e. those products that most represent their sales and/or purchasing behavior within a given product group. In order to match the sales balances in the national accounts, only prices are collected from companies that have production or import value within the specific product groups.
Each selected company is determined by their legal entity registration. In Denmark's Statistics Business Statistical Register, the legal entities are determined by their CVR number. In cases where a company has multiple CVR numbers sharing the same activity these can be combined into one unit from which prices are collected, for example, franchises. The companies must, as far as possible, report the price in force on the 15th of the month. If no price information is available for the 15th of the month, an appropriate day earlier in the month or an average of the prices for the first 15 days of the month can be utilized. For industries or products with high variation within the month – an average price for the whole month is instead preferred.
In order to meet the EU's requirements of actuality the index will from 2025 be using weights that are a maximum of 3 year old at the time of implementation from the Preliminary National Accounts. This means that the weights implemented in 2025 will be from 2022. However, the Preliminary National Accounts have a lower level of detail, which is why it is only possible to obtain the aggregate weight basis for 2022. In order to be able to calculate the individual goods' shares of the weight, we use the weight distributions from 2021 from the Final National Accounts. These are available at a very detailed level, which enables the distribution of weights on the individual goods. This means that the weight base for 2025 is 3 years old, while the weight distribution between goods is 4 years old. These weights covers the main part of all trading in the first turnover stage in Denmark, within the delimitation of the purpose of the statistics. Companies under a defined size are not included in the national accounts of the national accounts.
Price index for domestic supply of commodities
Approximately 7,400 prices are collected each month. Of these, approximately 3,800 prices are used for calculating the Producer Price Index for Commodities and approximately 3600 for calculating the Import Price Index for Commodities and approximately 5,900 prices to calculate the Domestic Supply Price Index.
The sample of approximately 7,400 prices are distributed over approximately 1100 item groups. These product groups are selected so that they cover a minimum of 70 percent of the total turnover value for the target population. Within each of these product groups, the largest companies are selected (top-down), based on revenue value. By selecting the largest companies within a given product group, it is assumed that as per basic market theory these larger companies, as price influencers, have both a large direct share or transactions but also an even larger indirect representativeness which helps to ensure a representative sample for the entire product group. Each of these companies is requested to select their most representative commodities, i.e. those products that most represent their sales and/or purchasing behavior within a given product group. In order to match the sales balances in the national accounts, only prices are collected from companies that have production or import value within the specific product groups.
Each selected company is determined by their legal entity registration. In Denmark's Statistics Business Statistical Register, the legal entities are determined by their CVR number. In cases where a company has multiple CVR numbers sharing the same activity these can be combined into one unit from which prices are collected, for example, franchises. The companies must, as far as possible, report the price in force on the 15th of the month. If no price information is available for the 15th of the month, an appropriate day earlier in the month or an average of the prices for the first 15 days of the month can be utilized. For industries or products with high variation within the month – an average price for the whole month is instead preferred.
In order to meet the EU's requirements of actuality the index will from 2025 be using weights that are a maximum of 3 year old at the time of implementation from the Preliminary National Accounts. This means that the weights implemented in 2025 will be from 2022. However, the Preliminary National Accounts have a lower level of detail, which is why it is only possible to obtain the aggregate weight basis for 2022. In order to be able to calculate the individual goods' shares of the weight, we use the weight distributions from 2021 from the Final National Accounts. These are available at a very detailed level, which enables the distribution of weights on the individual goods. This means that the weight base for 2025 is 3 years old, while the weight distribution between goods is 4 years old. These weights covers the main part of all trading in the first turnover stage in Denmark, within the delimitation of the purpose of the statistics. Companies under a defined size are not included in the national accounts of the national accounts.
Price index for domestic supply of commodities
| Index | Percentage change compared to previous month (per cent) | Percentage change compared to same month the year before (per cent) | |
|---|---|---|---|
| 2026M08 | |||
| Price Index for Domestic Supply, total | 123.7 | 0.9 | 6.7 |
| 02 Meat and edible meat offals | .. | .. | .. |
| 03 Fish and crustaceans | 148.3 | 1.3 | 21.0 |
| 04 Milk and dairy produce, etc. | .. | .. | .. |
| 05 Products of animal origin n.e.s. | 121.7 | 8.4 | 14.0 |
| 09 Coffee, tea, spices | 177.7 | -0.1 | -7.5 |
| Imported crude coffee | 205.8 | 0.1 | -10.1 |
| 11 Products of the milling industry, malt, starch, inulin and wheat gluten | 129.2 | -1.1 | -3.9 |
| 13 Schellac, hydrated rubber and resin, etc. | .. | .. | .. |
| 15 Animal and vegetable fats and oils | 153.7 | 5.8 | 14.0 |
| 16 Preparations of meat, fish and crustaceans | 125.4 | 0.0 | 1.0 |
| 17 Sugar and sugar confectionery | 110.0 | 0.7 | -2.5 |
| 18 Cocoa and other cocoa preparations | 157.9 | -0.3 | -4.5 |
| 19 Preparations of cereals, flour, starch og milk; bakery products | 124.1 | 0.2 | 2.2 |
| 20 Preparations of vegetables, fruit, nuts or other plants | 147.5 | 0.2 | -5.6 |
| 21 Miscellaneous edible preparations | 125.3 | 0.1 | 1.0 |
| 22 Beverages, ethanol and vinegar | 121.7 | -0.6 | 2.6 |
| 23 Residual products from the food processing industry; preparations of aminal feedstuffs | 112.9 | 1.6 | 10.4 |
| Imported oil cake | .. | .. | .. |
| 24 Tobacco and manufactured tobacce substitutes | 143.5 | 0.1 | 10.7 |
| Imported tobacco | .. | .. | .. |
| 25 Salt, sulphur, soil and stones; plaster, lime and cement | 134.6 | 0.0 | 1.9 |
| 27 Mineral fuels, mineraloil and distilery products thereof | 161.9 | 6.9 | 46.5 |
| Imported crude oil | 134.8 | 10.5 | 38.1 |
| Gasoline | .. | .. | .. |
| Gas oils | 199.0 | 9.8 | 80.1 |
| Fuel oils | .. | .. | .. |
| Imported lubrications oils and other oils | 157.5 | 1.6 | 28.5 |
| 28 Inorganic chemicals | 182.0 | 0.9 | 6.9 |
| 29 Organic chemicals | .. | .. | .. |
| 30 Pharmaceutical products | .. | .. | .. |
| 31 Fertilizers, total | .. | .. | .. |
| 32 Dyes, colours, paints | 120.5 | 0.5 | 1.6 |
| 33 Volatile vegetable oils and essential oils; perfymery, cosmetics, toiletpreparations | 112.5 | 0.0 | -1.9 |
| 34 Soap, washing and cleaning preparations | 122.6 | -0.3 | 3.3 |
| 35 Albuminoidal substances modified starch, glues and enzymes | .. | .. | .. |
| 37 Photographic and cinematographic goods | .. | .. | .. |
| 38 Miscellaneous chemical products | 125.7 | 0.3 | 5.7 |
| 39 Artificial resins and plastic materials, total | 120.2 | 0.0 | 14.0 |
| Other plasti, in primary forms | 115.5 | -1.4 | 25.3 |
| Imported plastic, in primaty forms | 115.2 | -1.5 | 25.5 |
| Semi-manufactures and articles of plastic materials | 122.9 | 0.8 | 8.9 |
| 40 Rubber and articles thereof, total | 118.0 | 0.9 | 2.3 |
| 41 Raw hides and skins and leather | .. | .. | .. |
| 42 Articles of leather; saddlery; luggage and bags, etc. | 102.1 | 1.1 | 1.5 |
| 44 Wood and articles of wood | 116.5 | 0.2 | 5.0 |
| Wood og conifers, total | 95.4 | -0.2 | 9.9 |
| Imported wood of conifers | 91.2 | 0.0 | 11.5 |
| Imported oak wood | .. | .. | .. |
| Imported tropical woods | .. | .. | .. |
| Articles of wood | 128.4 | 0.5 | 3.7 |
| 48 Paper and paperboard, articles thereof, total | 124.0 | 0.0 | 0.6 |
| Paper and paperboard, in rolls or sheets | 118.8 | -0.7 | -1.7 |
| Articles of paper and paperboard | 126.8 | 0.4 | 1.8 |
| 49 Printed materials | 115.4 | 1.3 | 1.6 |
| 55 Discontinuous man-made fibes | .. | .. | .. |
| 56 Cotton wool, nonwovens; cordage and rope and articles thereof | 122.7 | 0.3 | 9.5 |
| 57 Carpets and other flooring of textile materials | 112.3 | 1.1 | 8.5 |
| 59 Impregnated, knitted or crocheted textile articles; technical textile articles | .. | .. | .. |
| 61 Articles of apparel and accessories, of knitwear | 118.6 | 2.5 | -2.2 |
| 62 Articels of apparel and accessories, except knitwear | 127.0 | 1.8 | 8.5 |
| 63 Other made up textile articles | 107.8 | 0.0 | 0.4 |
| 64 Footwear, leggins and related parts | 100.3 | 0.1 | 0.2 |
| 68 Articles of stone, plaster, cement, etc. | 130.3 | 0.2 | 3.2 |
| 69 Ceramic products | 125.7 | 0.2 | 2.4 |
| 70 Glass and glassware | 115.9 | -0.3 | -1.7 |
| 71 Precious metals and articles thereof | 131.2 | -1.9 | 14.1 |
| 72 Iron and steel, total | 93.5 | 0.3 | 11.7 |
| Imported iron and steel | 92.9 | 0.3 | 10.9 |
| 73 Articles of iron and steel | 119.3 | 2.0 | 5.9 |
| 74 Copper and articles thereof, total | 148.1 | 2.1 | 19.9 |
| Imported crude copper and semimanufactrued copper | 158.7 | 2.7 | 28.6 |
| 76 Aluminium and articles thereof, total | 132.9 | 1.1 | 15.4 |
| Imported crude and semimanufactured aluminium | 141.7 | 1.1 | 23.2 |
| 79 Zinc and articles thereof, total | .. | .. | .. |
| Imported crude and semimanufactured zinc | .. | .. | .. |
| 82 Tools and implements of base metal | 126.7 | 0.2 | 5.7 |
| 83 Miscellaneous articles of base metal | 120.4 | -0.3 | 0.8 |
| 84 Machinery and appliances;mechanical implements and spare parts, total | 119.7 | 0.7 | 4.0 |
| Pumps for liquids, whether or not fitted with a measuring device; liquid elevators | .. | .. | .. |
| Agrigultural and horticultural machinery | 123.4 | 0.2 | 2.4 |
| Taps, valves and similar appliances for pipes, boilers and similar products | .. | .. | .. |
| Other machinery and appliances | 118.3 | 0.8 | 2.7 |
| 85 Electrical machinery and equipment and related parts | 107.0 | 0.5 | 0.2 |
| 86 Locomotives, wagons and other equipment for railways and tramways and parts thereof (2019-) | .. | .. | .. |
| 87 Vehicles and spare parts, total | 111.6 | -3.2 | -1.5 |
| Motor cars | 109.3 | -5.2 | -2.9 |
| Tractors | 125.7 | 0.0 | 2.5 |
| 90 Optical, photo and measuring equipment | 113.5 | -0.4 | 2.4 |
| 91 Clocks and watches and related parts | 118.1 | -0.2 | 0.6 |
| 94 Furniture and specified lighting equipment | 117.5 | 0.3 | -1.3 |
| 95 Toys; games, sports goods, etc. | .. | .. | .. |
| 96 Other goods (2019- ) | .. | .. | .. |
Approximately 7,400 prices are collected each month. Of these, approximately 3,800 prices are used for calculating the Producer Price Index for Commodities and approximately 3600 for calculating the Import Price Index for Commodities and approximately 5,900 prices to calculate the Domestic Supply Price Index.
The sample of approximately 7,400 prices are distributed over approximately 1100 item groups. These product groups are selected so that they cover a minimum of 70 percent of the total turnover value for the target population. Within each of these product groups, the largest companies are selected (top-down), based on revenue value. By selecting the largest companies within a given product group, it is assumed that as per basic market theory these larger companies, as price influencers, have both a large direct share or transactions but also an even larger indirect representativeness which helps to ensure a representative sample for the entire product group. Each of these companies is requested to select their most representative commodities, i.e. those products that most represent their sales and/or purchasing behavior within a given product group. In order to match the sales balances in the national accounts, only prices are collected from companies that have production or import value within the specific product groups.
Each selected company is determined by their legal entity registration. In Denmark's Statistics Business Statistical Register, the legal entities are determined by their CVR number. In cases where a company has multiple CVR numbers sharing the same activity these can be combined into one unit from which prices are collected, for example, franchises. The companies must, as far as possible, report the price in force on the 15th of the month. If no price information is available for the 15th of the month, an appropriate day earlier in the month or an average of the prices for the first 15 days of the month can be utilized. For industries or products with high variation within the month – an average price for the whole month is instead preferred.
In order to meet the EU's requirements of actuality the index will from 2025 be using weights that are a maximum of 3 year old at the time of implementation from the Preliminary National Accounts. This means that the weights implemented in 2025 will be from 2022. However, the Preliminary National Accounts have a lower level of detail, which is why it is only possible to obtain the aggregate weight basis for 2022. In order to be able to calculate the individual goods' shares of the weight, we use the weight distributions from 2021 from the Final National Accounts. These are available at a very detailed level, which enables the distribution of weights on the individual goods. This means that the weight base for 2025 is 3 years old, while the weight distribution between goods is 4 years old. These weights covers the main part of all trading in the first turnover stage in Denmark, within the delimitation of the purpose of the statistics. Companies under a defined size are not included in the national accounts of the national accounts.
Calculating the change in percentage
How to calculate the percentage change between two periods using index values.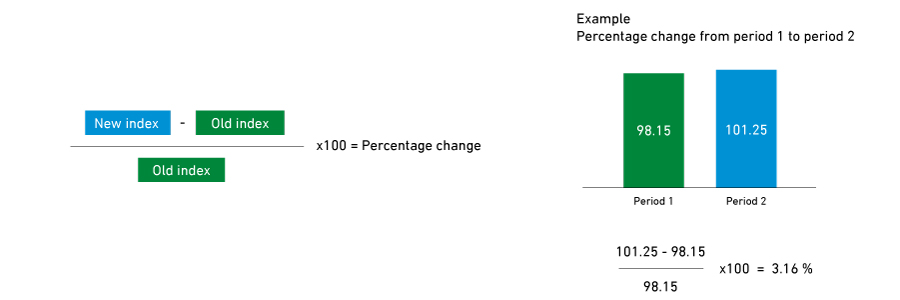
Calculating percentage change from year to year (instead of month to month)? Use table PRIS02

On the statistics – documentation, sources and method
See the documentation of statistics to learn more:
The statistics Producer and Import Price Index for Commodities show the price development of commodities in the first stage of transaction. The primary use is as deflators (converting nominal values to real values), but is also used as a business cycle indicator and for contract adjustments in the business sector. The index can be divided into Producer price index for commodities, Import price index for commodities and Price index for domestic commodities supply. The Price index for domestic supply of commodities can be traced back to 1876 and in the current form back to 1981. Producer Price Index for Commodities dates back to 2000 and Import Price Index for Commodities to 2005.