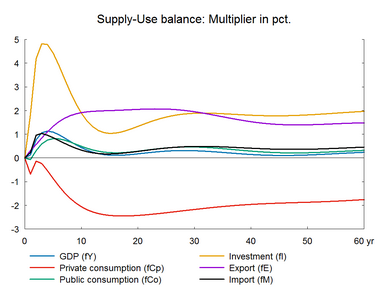
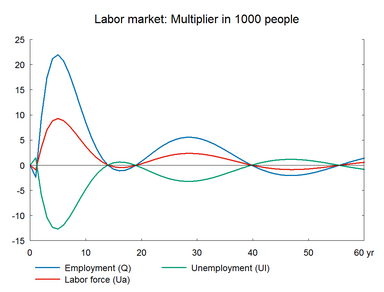
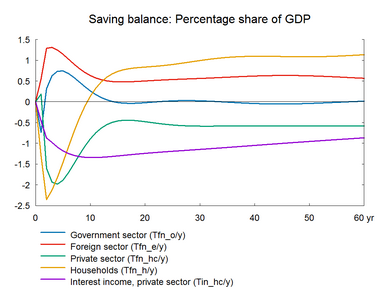
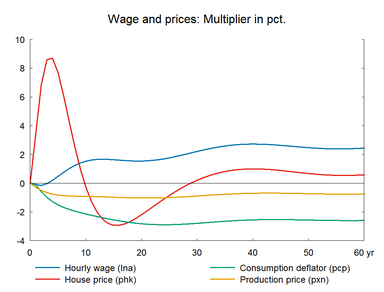
Due to the fixed exchange rate policy, the Danish interest rates are largely determined by conditions abroad. They are basically exogenous like foreign prices and foreign demand. In the experiment, both the domestic and foreign interest rates in ADAM are permanently reduced by 1 percentage point i.e. from 3.5 percent in the baseline scenario to 2.5 percent. The experiment does not take into account that a general fall in foreign interest rates can stimulate foreign markets and foreign competitiveness. Thus, the experiment maybe interpreted as a 1 percentage point reduction in the interest rate differential to the Euro zone interest rates. For a broader discussion of the interest rate experiment see grh12912. The following two sections present the effects of reducing interest rates - with and without balanced public budget.
Both domestic and foreign interest rates are permanently reduced by 1 percentage point. (See experiment)
Table 15a. The effect of a permanent fall in interest rates
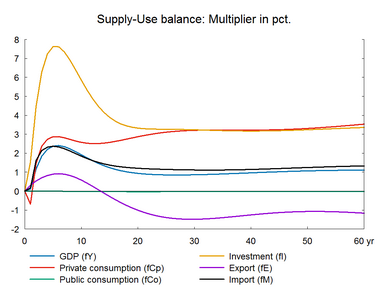
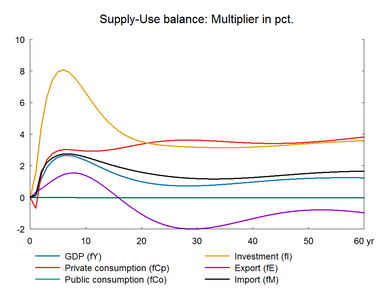
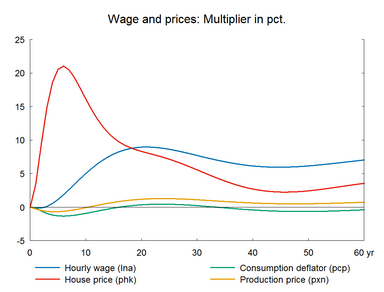
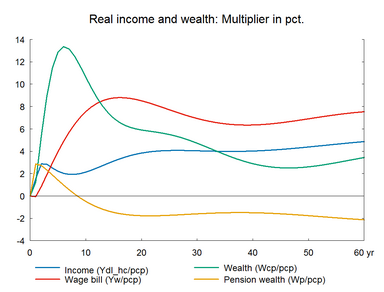
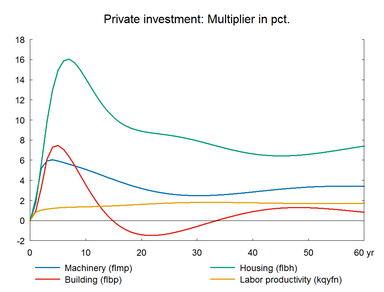
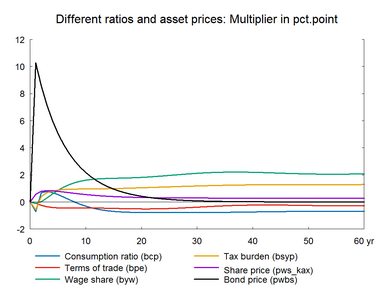
The lower interest rates have an expansionary effect on both investment and private consumption. The effect on consumption comes primarily from the effect on the housing market. Lower interest rates reduce the cost of capital and the demand for capital increases. The demand for capital including housing capital also increases due to the substitution effect.▼ A substitution effect arises when a change in the relative prices of factors induces producers to use more of a relatively cheaper factor and less of a relatively more expensive factor. The higher capital demand increases investment and house prices. A rise in house price increases housing wealth, and since housing wealth is part of the total private wealth, private consumption increases. However, there is a delay in the response of private consumption to wealth. The decrease in the cost of capital also reduces prices and improves competitiveness, so exports increase in the short run. Thus, the short-run effect is positive on both domestic demand and exports.
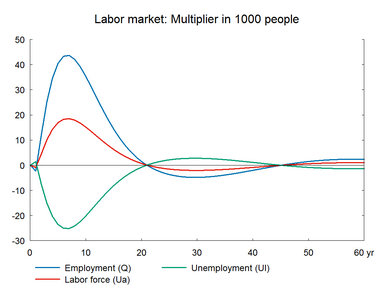
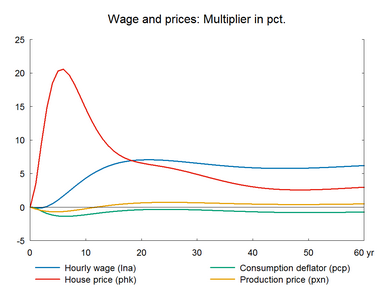
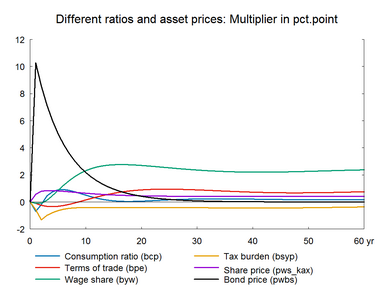
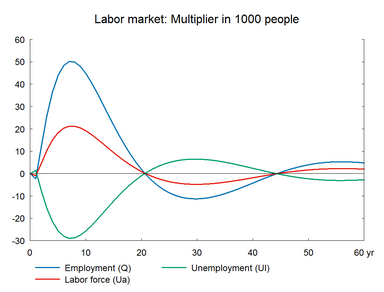
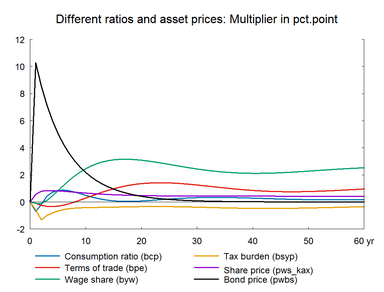
The strong demand is met by increased domestic production and increased imports, and employment increases and drives wages upward. Despite the rise in wages, output prices fall at first as the cost of capital falls. This immediate positive effect on competitiveness reflects that the interest rate reduction works like a drop in the interest rate differential vis-a-vis the exogenous foreign interest rates. Later on, the wage effects on prices dominate and the wage-driven crowding out brings employment back to the baseline.▼ The wage relation in ADAM is a Phillips curve, which links the changes in wages to unemployment. A fall/rise in unemployment pushes wages and hence prices upward/downward and reduces/improves competitiveness. So exports and production decrease/increase and over time unemployment returns to its baseline. This is the wage-driven crowding out process.
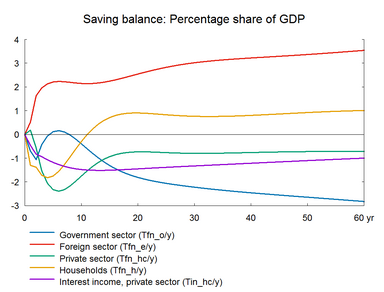
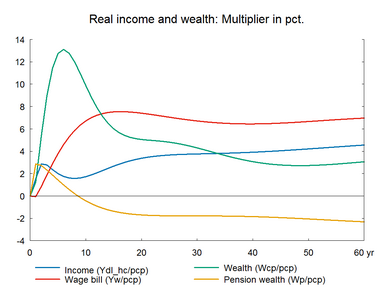
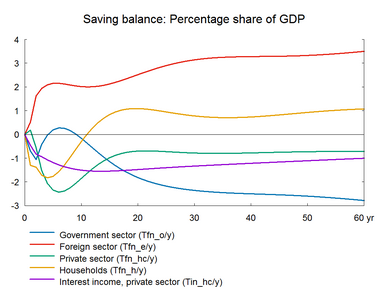
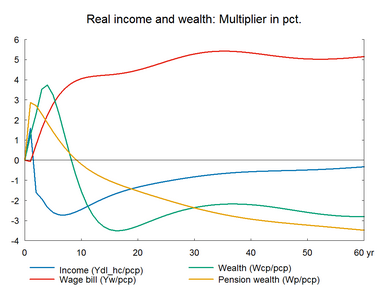
Private consumption increases permanently due to the positive real wage effect.▼ Real wage effect arises because wages increase/decrease more than the general price levels due to the deadweight from the non-responding exogenous import prices. This creates a positive/negative real wage effect and real disposable income and private consumption increase/decrease permanently. More basically, the long term positive effect on disposable income and private consumption reflects that the interest rate after tax is lower than the growth rate implying that lower private net assets do not harm consumption, see the discussion in the ADAM book. The lower private financial net assets reflect two mechanisms: 1) a decrease in total private wealth due to the decrease in pension savings that follows from the lower return on pension assets and more basically 2) the increase in the housing stock and hence in housing wealth. The desired private financial net assets equal total desired private wealth minus housing wealth. Total desired wealth of the private sector is determined in the long term by the consumption function and income, as income minus consumption represents private savings.
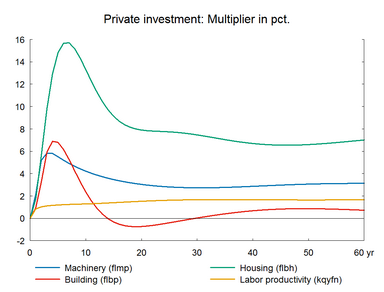
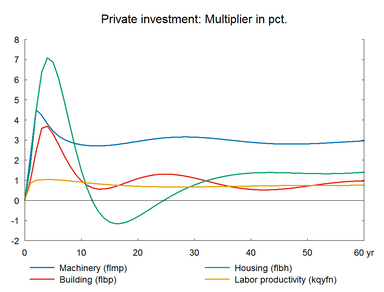
The long-term effect on total investment remains positive. The permanent fall in interest rates and the permanent rise in wages imply that capital stocks remain relatively cheaper than labor. So that the capital stock and investments increase permanently. The effect is strongest on housing investment and smallest on businesses building investment. The user cost is based on smaller depreciation rate for buildings than for machinery, so the user cost of business buildings falls more in percentage terms. However, the higher substitution possibility in machinery than in buildings implies that machinery investments rise by more than building investments.
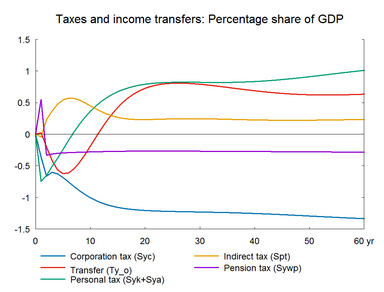
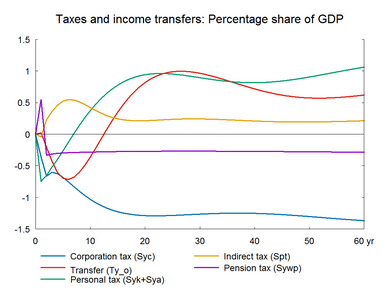
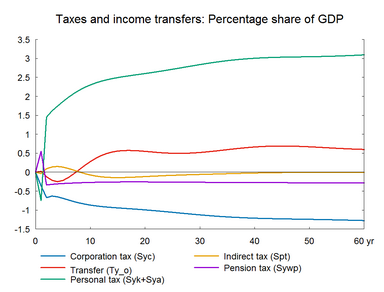
The public budget deteriorates in the long term due to lower revenues from the taxation of private net financial income. A tax increase in order to keep the budget balance constant will almost eliminate the positive long-term effect on consumption. In general, the lower interest rate acts as a positive demand shock increasing the demand for capital through lower user costs and increasing the propensity to consume through the negative impact on institutional pension savings.
Figure 15a. The effect of a permanent 1 percentage point fall in interest rates
|
||||||||||||||||||||||||||||||||||||||||||||||||||||||||||||||||||||||||||||||||||||||||||||||||||||||||||||||||||||||||||||||||||||||||||||||||||||||||||||||||||||||||||||||||||||||||||||||||||||||||||||||||||||||||||||||||||||||||||||||||||||||||||||||||||||||||||||||||||||||||||||||||||||||||||||||||||||||||||||||||||||
The experiment in section A is repeated accompanied by improved export performance.(See experiment)
Table 15b. The effect of a permanent fall in interest rates, with supply effects
Figure 15b. The effect of a permanent fall in interest rates, with supply effects
|
||||||||||||||||||||||||||||||||||||||||||||||||||||||||||||||||||||||||||||||||||||||||||||||||||||||||||||||||||||||||||||||||||||||||||||||||||||||||||||||||||||||||||||||||||||||||||||||||||||||||||||||||||||||||||||||||||||||||||||||||||||||||||||||||||||||||||||||||||||||||||||||||||||||||||||||||||||||||||||||||||||
The experiment in section B is repeated with an increase in income tax rates to balance the public budget.(See experiment)
Table 15c. The effect of a permanent fall in interest rates, balanced budget
Figure 15c. The effect of a permanent fall in interest rates, balanced budget
|
||||||||||||||||||||||||||||||||||||||||||||||||||||||||||||||||||||||||||||||||||||||||||||||||||||||||||||||||||||||||||||||||||||||||||||||||||||||||||||||||||||||||||||||||||||||||||||||||||||||||||||||||||||||||||||||||||||||||||||||||||||||||||||||||||||||||||||||||||||||||||||||||||||||||||||||||||||||||||||||||||||
