12. Productivity - labor efficiency

Increasing the efficiency of labor increases the supply of labor measured in efficiency units. An increase in labor efficiency means that the same amount of labor can produce higher output. It also reduces the demand for other factors through substitution effects. The multiplier properties are demonstrated with and without balanced public budget.


hmtoggle_arrow1A. Labor efficiency


In this experiment, labor efficiency is increased permanently by 1 percent. (See experiment)


Table 12a. The effect of a permanent increase in labor efficiency

    1. yr 2. yr 3. yr 4. yr 5. yr 10. yr 15. yr 20. yr 25. yr 30. yr
    Million 2010-Dkr.
Priv. consumption fCp 31 1030 1626 2058 2254 1092 -884 -1961 -2060 -1557
Pub. consumption fCo -22 -17 -14 -11 -8 -4 -7 -15 -24 -35
Investment fI 383 933 1860 2637 3222 4014 3388 3168 3494 4006
Export fE 2324 3856 5480 7177 8926 17567 24625 29436 32166 33400
Import fM 129 877 1658 2354 2910 4430 5269 6261 7280 8090
GDP fY 2480 4641 6806 8848 10666 16761 19926 22154 23900 25203
    1000 Persons
Employment Q -18.79 -17.68 -16.02 -14.06 -12.03 -3.76 0.59 2.64 3.26 2.84
Unemployment Ul 11.63 10.13 9.14 8.00 6.83 2.11 -0.37 -1.53 -1.88 -1.63
    Percent of GDP
Pub. budget balance Tfn_o/Y -0.08 -0.08 -0.01 0.07 0.14 0.38 0.48 0.54 0.60 0.65
Priv. saving surplus Tfn_hc/Y 0.10 0.09 0.01 -0.07 -0.12 -0.19 -0.09 -0.01 0.01 0.02
Balance of payments Enl/Y 0.02 0.00 0.00 0.01 0.02 0.19 0.39 0.53 0.61 0.66
Foreign receivables Wnnb_e/Y 0.41 0.56 0.66 0.74 0.82 1.60 3.01 4.80 6.69 8.53
Bond debt Wbd_os_z/Y 0.18 0.26 0.26 0.19 0.05 -1.26 -2.96 -4.68 -6.35 -7.95
    Percent
Capital intensity fKn/fX -0.14 -0.24 -0.34 -0.42 -0.48 -0.62 -0.66 -0.69 -0.71 -0.68
Labour intensity hq/fX -0.81 -0.88 -0.94 -0.99 -1.01 -1.04 -1.01 -0.99 -0.97 -0.96
User cost uim -0.36 -0.47 -0.57 -0.66 -0.75 -1.05 -1.19 -1.21 -1.17 -1.10
Wage lna -0.31 -0.64 -0.92 -1.17 -1.39 -2.05 -2.20 -2.09 -1.85 -1.60
Consumption price pcp -0.33 -0.46 -0.57 -0.68 -0.78 -1.16 -1.36 -1.43 -1.41 -1.34
Terms of trade bpe -0.25 -0.33 -0.41 -0.48 -0.54 -0.78 -0.88 -0.89 -0.85 -0.79
    Percentage-point
Consumption ratio bcp -0.10 -0.08 -0.04 0.01 0.05 0.05 -0.06 -0.15 -0.19 -0.20
Wage share byw -0.30 -0.42 -0.51 -0.58 -0.63 -0.69 -0.61 -0.50 -0.40 -0.32

(See details)


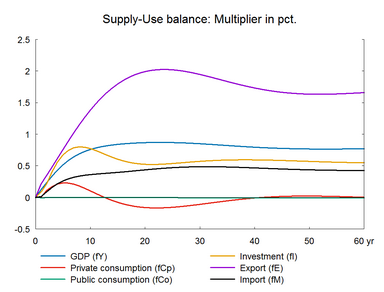
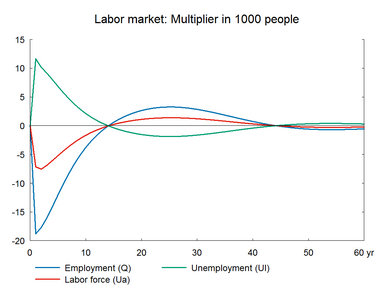
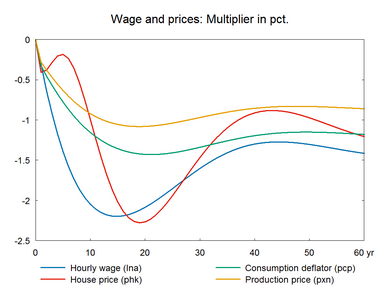
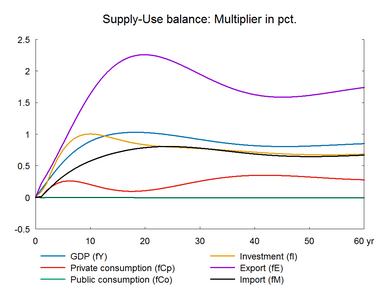
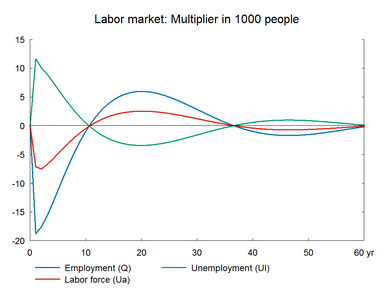
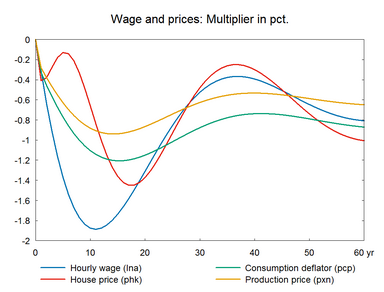
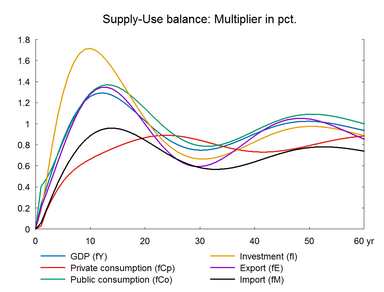
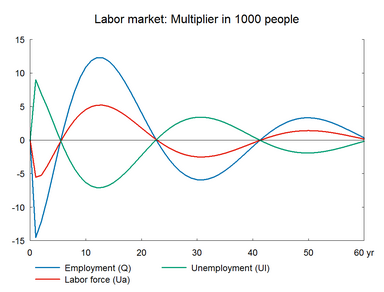
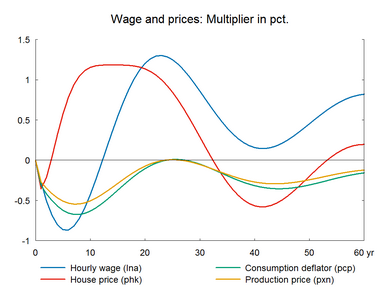
As the amount of output demanded can be produced by less labor, employment falls already in the first year, and due to lags in the labor demand relation, due to for example labor hoarding, the negative effect on employment peaks in the second year. The lower employment reduces wage growth and the wage-driven crowding out returns employment to its baseline. The wage relation in ADAM is a Phillips curve, which links the changes in wages to unemployment. A fall/rise in unemployment pushes wages and hence prices upward/downward and reduces/improves competitiveness. So exports and production decrease/increase and over time unemployment returns to its baseline. This is the wage-driven crowding out process.


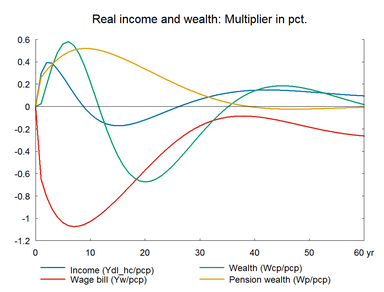
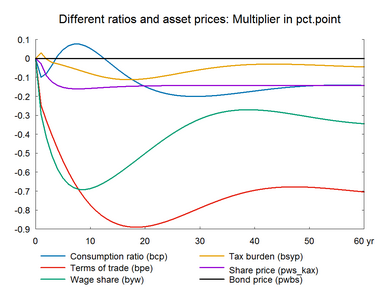
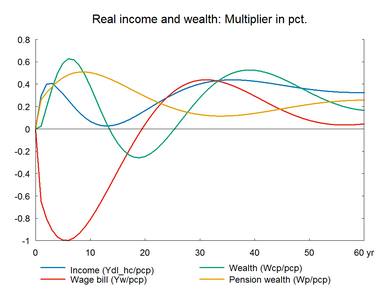
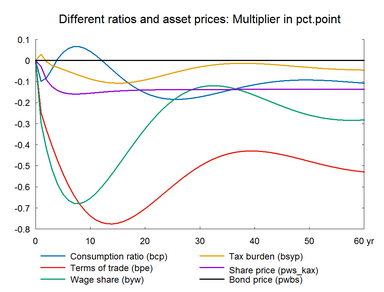
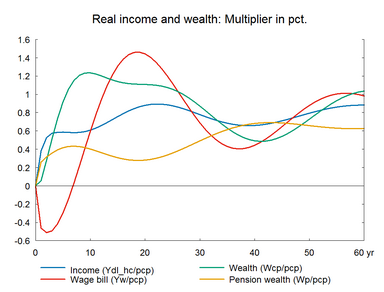
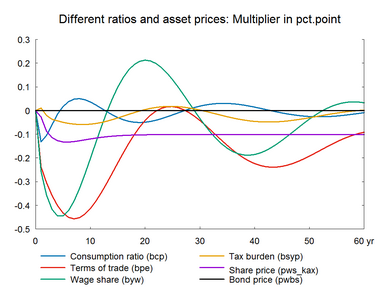
Compared to the previous two experiments - increase in number of workers and working hours - nominal hourly wages fall by a smaller percentage when labor efficiency improves, because production costs fall and make producer prices fall. Therefore, nominal wages do not have to decrease substantially to induce the fall in prices, that is necessary to make net exports increase and offset the initial fall in labor demand. This also explains the quicker response in exports in the present experiment, compared to the previous two experiments. Moreover, in the long run there is only a small negative effect on real hourly wages and there is no effect on private consumption in the long run.


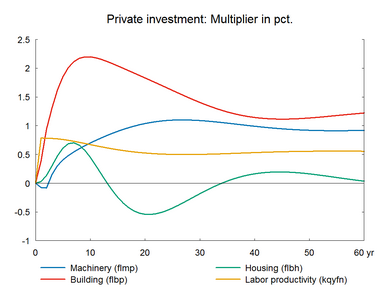
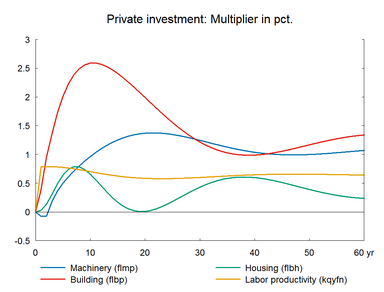
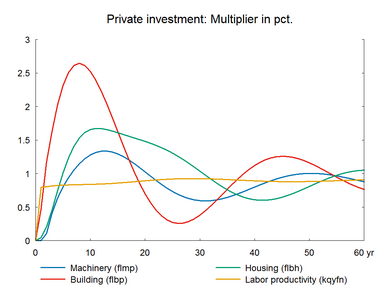
The long term impact on investments is positive as there is a long term positive impact on production. Both capital intensity and labor intensity of production fall with the usual measure of intensity, and the fall in the latter is stronger as a result labor productivity increases. Note the efficiency corrected labor intensity increases relative to the baseline and production involves less capital and more labor in efficiency units. Due to this, output per working hour increases by less than 1 percent despite the 1 percent increase in labor efficiency.


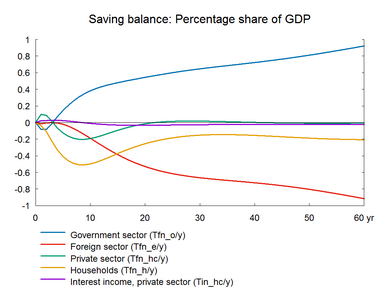
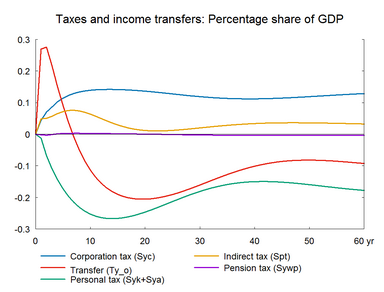
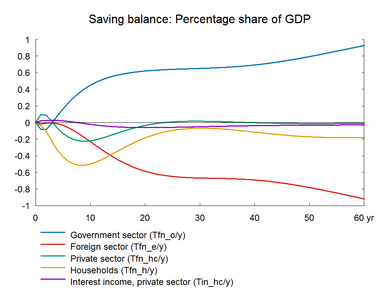
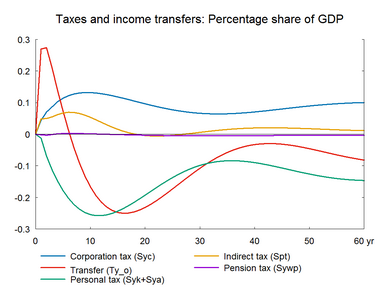
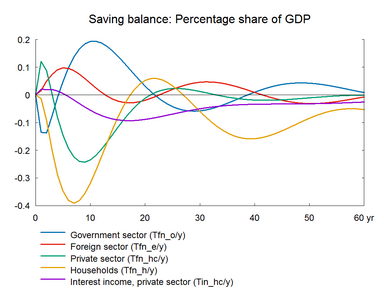
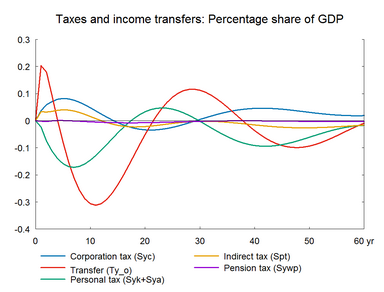
Note that the higher unemployment in the short run raises unemployment benefits and worsens public finance temporarily. Later on the initial worsening in the government budget is reversed and the permanent budget effect is positive as employment rises and tax revenues increase. The improved competitiveness and the additional public savings also enhances the balance of payment.


Figure 12a. The effect of a permanent increase in labor efficiency

fig_12_1a_zoom38fig_12_2a_zoom38


fig_12_3a_zoom38fig_12_4a_zoom38


fig_12_5a_zoom38fig_12_6a_zoom38


fig_12_7a_zoom38fig_12_8a_zoom38

hmtoggle_arrow1B. Labor efficiency - including supply effects on exports


A permanent increase in labor efficiency has a permanent positive effect on domestic output; and it is likely that the market shares of danish exporter will rise. Table 10x presents the effect of a permanent increase in labor efficiency accompanied by supply effects in foreign trade. In contrast to section A, export performance are improved by an elasticity of 0.7 relative to GVA (gross value added).(See experiment)


Table 12b. The effect of a permanent increase in labor efficiency, with supply effects

    1. yr 2. yr 3. yr 4. yr 5. yr 10. yr 15. yr 20. yr 25. yr 30. yr
    Million 2010-Dkr.
Priv. consumption fCp 31 1038 1674 2176 2474 2147 1251 1306 2282 3652
Pub. consumption fCo -22 -17 -14 -11 -9 -6 -16 -30 -46 -60
Investment fI 383 972 1981 2871 3597 5223 5151 5028 5182 5430
Export fE 2324 3991 5846 7862 9998 20846 29103 33383 34331 33462
Import fM 129 963 1910 2842 3691 7078 9504 11305 12456 12994
GDP fY 2480 4736 7084 9389 11538 19631 24058 26230 27049 27211
    1000 Persons
Employment Q -18.79 -17.61 -15.78 -13.57 -11.23 -0.94 4.50 5.97 4.97 2.82
Unemployment Ul 11.63 10.09 8.99 7.71 6.36 0.47 -2.62 -3.43 -2.85 -1.60
    Percent of GDP
Pub. budget balance Tfn_o/Y -0.08 -0.08 -0.01 0.08 0.16 0.45 0.57 0.62 0.64 0.65
Priv. saving surplus Tfn_hc/Y 0.10 0.09 0.01 -0.07 -0.13 -0.22 -0.13 -0.03 0.01 0.02
Balance of payments Enl/Y 0.02 0.01 0.01 0.01 0.03 0.23 0.45 0.59 0.65 0.67
Foreign receivables Wnnb_e/Y 0.41 0.56 0.65 0.72 0.80 1.52 2.96 4.84 6.81 8.66
Bond debt Wbd_os_z/Y 0.18 0.26 0.25 0.17 0.01 -1.51 -3.53 -5.50 -7.25 -8.78
    Percent
Capital intensity fKn/fX -0.14 -0.25 -0.36 -0.45 -0.52 -0.71 -0.73 -0.69 -0.61 -0.51
Labour intensity hq/fX -0.81 -0.89 -0.95 -1.00 -1.03 -1.08 -1.06 -1.03 -1.01 -0.99
User cost uim -0.36 -0.47 -0.57 -0.66 -0.75 -1.02 -1.07 -1.00 -0.88 -0.76
Wage lna -0.31 -0.64 -0.91 -1.16 -1.37 -1.88 -1.74 -1.31 -0.85 -0.52
Consumption price pcp -0.33 -0.46 -0.57 -0.67 -0.77 -1.10 -1.21 -1.15 -1.02 -0.88
Terms of trade bpe -0.25 -0.33 -0.41 -0.48 -0.54 -0.74 -0.78 -0.71 -0.60 -0.50
    Percentage-point
Consumption ratio bcp -0.10 -0.08 -0.04 0.01 0.04 0.04 -0.07 -0.15 -0.18 -0.17
Wage share byw -0.30 -0.42 -0.52 -0.59 -0.63 -0.65 -0.50 -0.32 -0.19 -0.13

(See details)


Figure 12b. The effect of a permanent increase in labor efficiency, with supply effects


fig_12_1b_zoom38fig_12_2b_zoom38


fig_12_3b_zoom38fig_12_4b_zoom38


fig_12_5b_zoom38fig_12_6b_zoom38


fig_12_7b_zoom38fig_12_8b_zoom38

hmtoggle_arrow1C. Labor efficiency - balanced budget


The supply effect on exports ensures a balanced public budget leaving almost no room for income tax induced balancing in the public budget.(See experiment)


Table 12c. The effect of a permanent increase in labor efficiency, balanced budget

    1. yr 2. yr 3. yr 4. yr 5. yr 10. yr 15. yr 20. yr 25. yr 30. yr
    Million 2010-Dkr.
Priv. consumption fCp 261 1652 2675 3625 4420 7015 8918 10635 11719 11983
Pub. consumption fCo 2065 2486 3065 3754 4486 7546 8485 7743 6622 6216
Investment fI 813 2055 3613 5002 6167 8905 8132 6322 4974 4662
Export fE 2222 3811 5520 7303 9102 16300 17798 14698 11049 10178
Import fM 553 1870 3281 4682 5989 10876 12678 12090 10599 9710
GDP fY 4691 7861 11146 14420 17485 27803 29481 26201 22708 22200
    1000 Persons
Employment Q -14.51 -12.14 -8.98 -5.39 -1.75 10.89 11.06 4.07 -2.92 -5.90
Unemployment Ul 8.98 6.89 5.02 2.94 0.85 -6.33 -6.33 -2.27 1.73 3.40
    Percent of GDP
Pub. budget balance Tfn_o/Y -0.14 -0.14 -0.08 -0.01 0.05 0.19 0.14 0.03 -0.04 -0.06
Priv. saving surplus Tfn_hc/Y 0.12 0.09 0.00 -0.08 -0.15 -0.23 -0.12 -0.01 0.02 0.01
Balance of payments Enl/Y -0.01 -0.05 -0.07 -0.09 -0.10 -0.04 0.02 0.02 -0.02 -0.05
Foreign receivables Wnnb_e/Y 0.28 0.26 0.16 0.00 -0.18 -1.07 -1.40 -1.27 -1.01 -0.81
Bond debt Wbd_os_z/Y 0.20 0.31 0.36 0.34 0.28 -0.45 -1.07 -1.17 -0.91 -0.56
    Percent
Capital intensity fKn/fX -0.21 -0.35 -0.47 -0.57 -0.64 -0.67 -0.38 -0.05 0.13 0.14
Labour intensity hq/fX -0.74 -0.82 -0.87 -0.91 -0.92 -0.91 -0.87 -0.87 -0.90 -0.93
User cost uim -0.34 -0.43 -0.50 -0.55 -0.58 -0.50 -0.22 0.01 0.07 -0.02
Wage lna -0.27 -0.51 -0.68 -0.80 -0.86 -0.43 0.54 1.20 1.25 0.86
Consumption price pcp -0.31 -0.42 -0.50 -0.57 -0.62 -0.63 -0.37 -0.10 0.01 -0.05
Terms of trade bpe -0.24 -0.31 -0.36 -0.40 -0.43 -0.42 -0.22 -0.04 0.02 -0.04
    Percentage-point
Consumption ratio bcp -0.13 -0.11 -0.06 -0.01 0.02 0.04 -0.03 -0.05 -0.02 0.02
Wage share byw -0.26 -0.36 -0.42 -0.44 -0.45 -0.20 0.10 0.21 0.13 -0.03

(See details)


Figure 12c. The effect of a permanent increase in labor efficiency, balanced budget


fig_12_1c_zoom38fig_12_2c_zoom38


fig_12_3c_zoom38fig_12_4c_zoom38


fig_12_5c_zoom38fig_12_6c_zoom38


fig_12_7c_zoom38fig_12_8c_zoom38