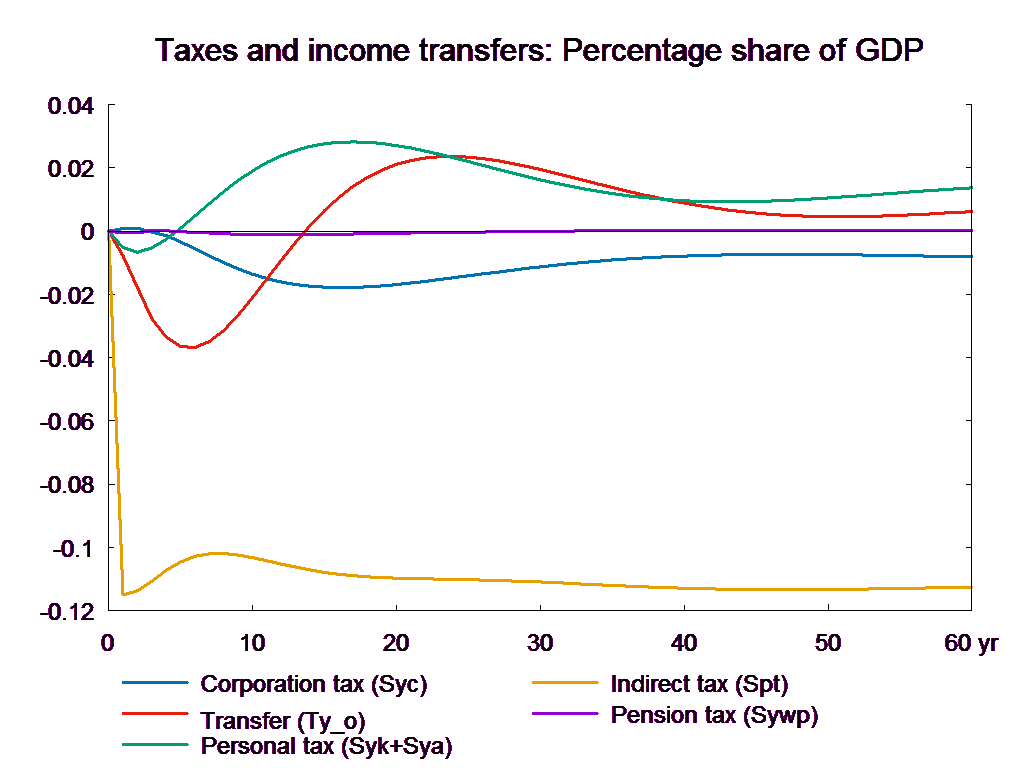
Instead of direct taxes, governments can reduce indirect taxes to create expansionary effects in the economy. The effect on the economy is channelled through reduction in final prices.
Table 7 presents the effect of a permanent reduction in indirect taxes. The VAT rate is reduced by approximately 0.3 percentage points, which corresponds to an immediate loss in revenue of 0.1 percent of GDP in 2010 prices. (See experiment)
Table 7. The effect of a permanent reduction in indirect taxes
| 1. yr | 2. yr | 3. yr | 4. yr | 5. yr | 10. yr | 15. yr | 20. yr | 25. yr | 30. yr | ||
| Million 2010-Dkr. | |||||||||||
| Priv. consumption | fCp | 646 | 1182 | 1561 | 1853 | 2065 | 2590 | 2960 | 3363 | 3709 | 3969 |
| Pub. consumption | fCo | 0 | 0 | 0 | 0 | -1 | -4 | -7 | -8 | -7 | -7 |
| Investment | fI | 285 | 638 | 901 | 1094 | 1224 | 1188 | 861 | 710 | 684 | 694 |
| Export | fE | 92 | 113 | 105 | 70 | 9 | -648 | -1573 | -2346 | -2781 | -2901 |
| Import | fM | 378 | 715 | 926 | 1077 | 1171 | 1134 | 881 | 723 | 659 | 658 |
| GDP | fY | 667 | 1235 | 1645 | 1939 | 2123 | 2004 | 1403 | 1068 | 1033 | 1184 |
| 1000 Persons | |||||||||||
| Employment | Q | 0.37 | 0.88 | 1.31 | 1.65 | 1.88 | 1.66 | 0.58 | -0.20 | -0.51 | -0.51 |
| Unemployment | Ul | -0.23 | -0.53 | -0.77 | -0.97 | -1.09 | -0.95 | -0.32 | 0.12 | 0.29 | 0.29 |
| Percent of GDP | |||||||||||
| Pub. budget balance | Tfn_o/Y | -0.07 | -0.06 | -0.04 | -0.03 | -0.03 | -0.05 | -0.09 | -0.12 | -0.14 | -0.15 |
| Priv. saving surplus | Tfn_hc/Y | 0.06 | 0.03 | 0.00 | -0.02 | -0.03 | -0.03 | -0.01 | 0.00 | 0.00 | 0.00 |
| Balance of payments | Enl/Y | -0.01 | -0.03 | -0.04 | -0.05 | -0.06 | -0.08 | -0.10 | -0.12 | -0.14 | -0.15 |
| Foreign receivables | Wnnb_e/Y | 0.05 | -0.01 | -0.08 | -0.16 | -0.25 | -0.67 | -1.04 | -1.41 | -1.79 | -2.18 |
| Bond debt | Wbd_os_z/Y | 0.08 | 0.13 | 0.16 | 0.19 | 0.21 | 0.33 | 0.60 | 0.97 | 1.37 | 1.76 |
| Percent | |||||||||||
| Capital intensity | fKn/fX | -0.02 | -0.04 | -0.05 | -0.05 | -0.04 | 0.04 | 0.10 | 0.13 | 0.14 | 0.14 |
| Labour intensity | hq/fX | -0.01 | -0.02 | -0.03 | -0.03 | -0.03 | -0.02 | -0.01 | -0.02 | -0.02 | -0.03 |
| User cost | uim | -0.05 | -0.05 | -0.05 | -0.04 | -0.04 | 0.01 | 0.05 | 0.06 | 0.06 | 0.05 |
| Wage | lna | 0.00 | 0.01 | 0.03 | 0.05 | 0.08 | 0.24 | 0.34 | 0.35 | 0.32 | 0.28 |
| Consumption price | pcp | -0.13 | -0.13 | -0.13 | -0.13 | -0.12 | -0.07 | -0.03 | -0.01 | -0.01 | -0.02 |
| Terms of trade | bpe | -0.01 | -0.01 | -0.01 | 0.00 | 0.00 | 0.04 | 0.07 | 0.08 | 0.08 | 0.07 |
| Percentage-point | |||||||||||
| Consumption ratio | bcp | -0.07 | -0.04 | -0.02 | 0.00 | 0.01 | 0.02 | 0.01 | 0.02 | 0.02 | 0.03 |
| Wage share | byw | -0.01 | -0.01 | 0.00 | 0.01 | 0.02 | 0.07 | 0.08 | 0.07 | 0.05 | 0.03 |
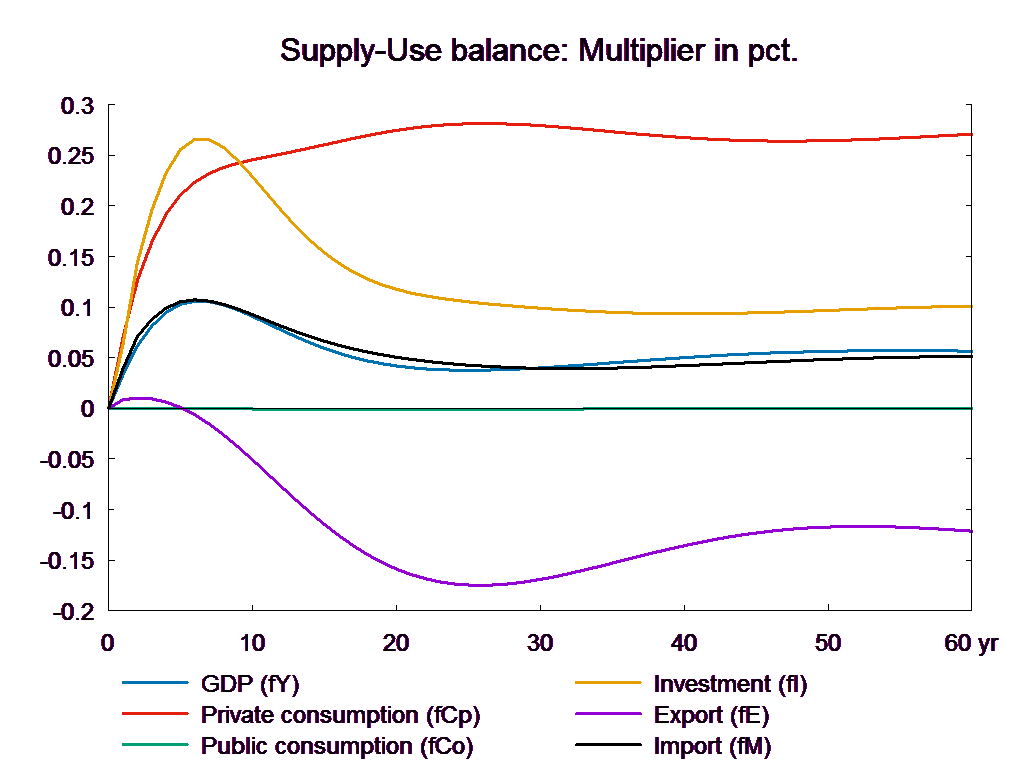
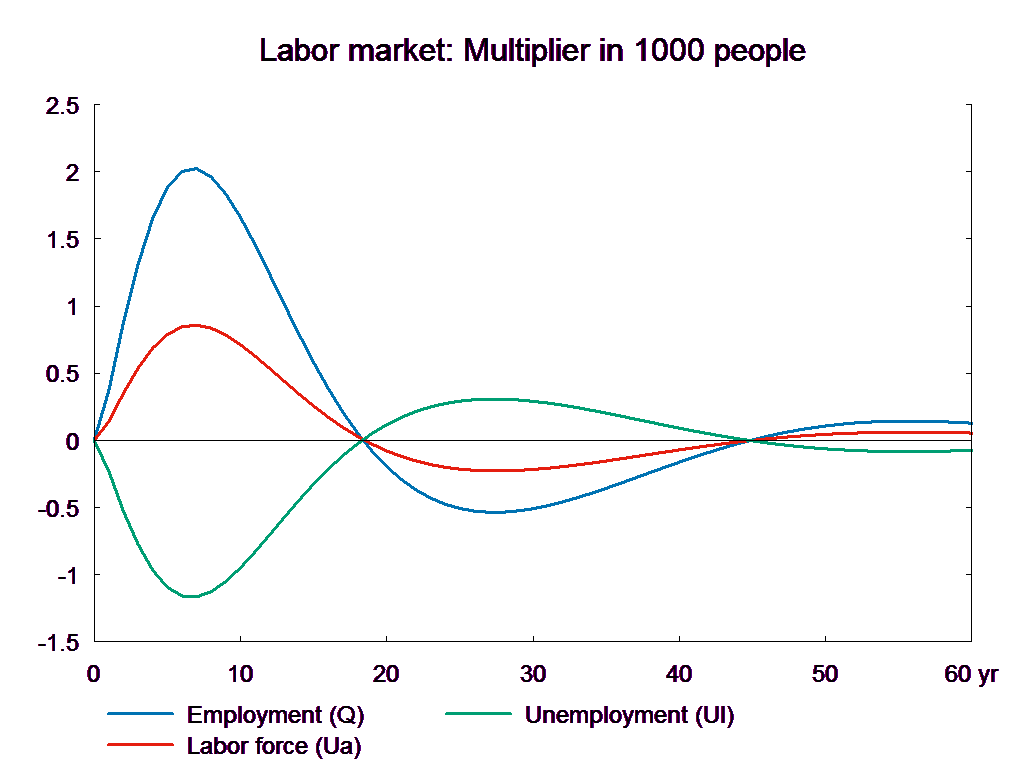
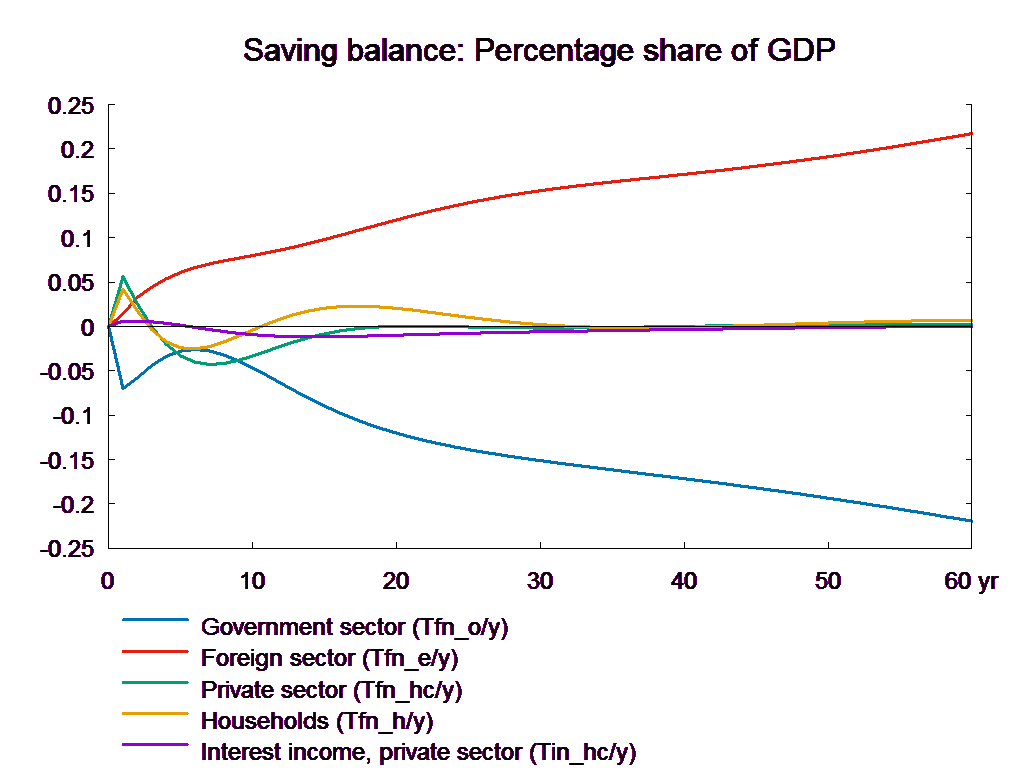
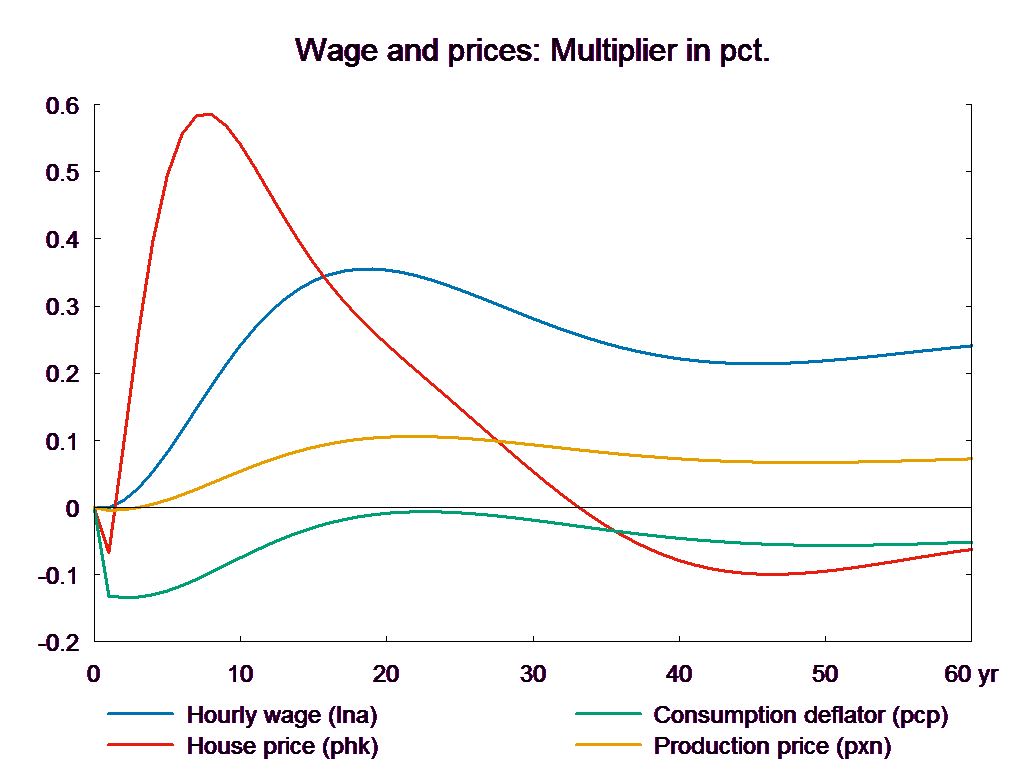
The cut in VAT immediately reduces prices for final goods and services. This in turn raises real disposable income and thereby private consumption. In the previous income tax experiment, the expansion comes from a direct increase in disposable income. In the present experiment, the expansionary effect arises as the fall in prices increase real income. The short-term effect on private consumption is smaller than the effect in the previous income tax experiment. Fall in income tax directly affects consumption through nominal disposable income, whereas VAT goes through prices and concerns a broader group of goods than just private consumption. The rise in private consumption expands production and employment. It also increases the demand for housing, and house prices and housing investment increase. The fall in unemployment increases wage growth, which in turn raises production costs and producer prices. As a result competitiveness worsens, exports fall and imports rise in the long run. Thus, the positive effect on private consumption and housing investment is counterbalanced by a permanent negative effect on net exports.
The VAT reduction affects the relationship between production costs and final market prices. Despite the rise in wages and output prices, consumption prices fall when VAT rates are reduced. Like a lower income tax, the lower VAT has a positive long-term effect on real income, which gives rise to a change in the composition of demand.
A fall in indirect taxes has also a positive effect on production. The rise in wages makes capital relatively cheaper and the capital intensity of production increases and makes labor more productive, as a result production increases.
Note that there is no VAT on house price. But, there is a negative first year effect on house price. This is because the house price equation determines the real house price – nominal house price divided by consumption price – and the latter falls as VAT rates fall. In the following years the increased demand stimulates house price but in the long run the house price effect is slightly negative reflecting that the supply price, the housing investment deflator, does include VAT. In general, the VAT experiment resembles the direct tax experiment, but there are some differences, for example, there is an immediate positive impact on service exports as the lower consumer price stimulates the fixed-price purchases of foreign tourists. Just like the fall in direct taxes, the reduction in VAT deteriorates the public balance permanently.
Figure 7. The effect of a permanent reduction in indirect taxes