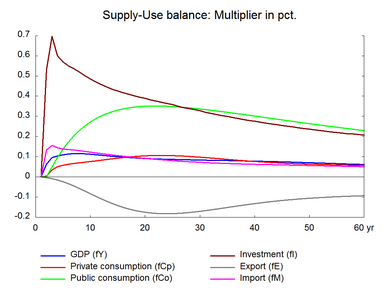
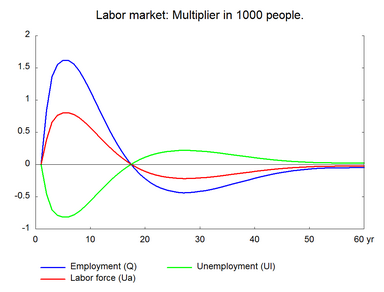
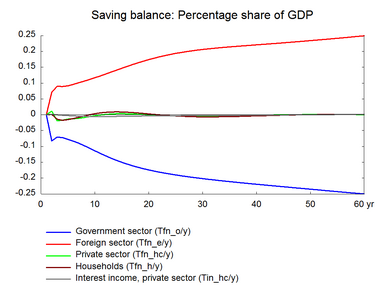
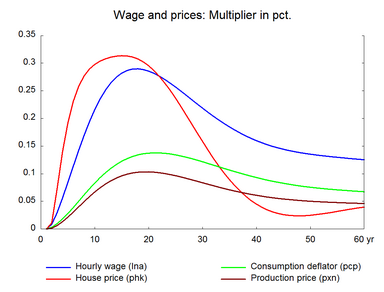
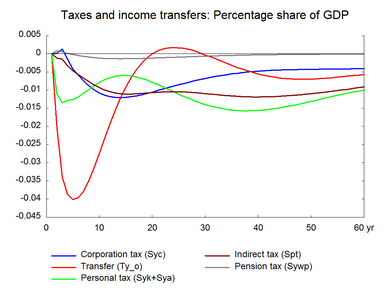
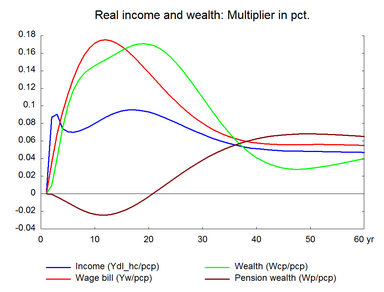
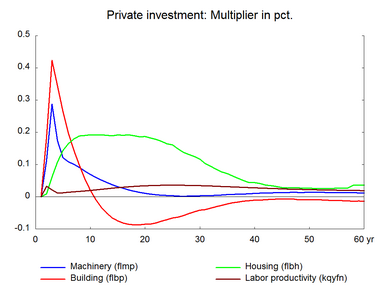
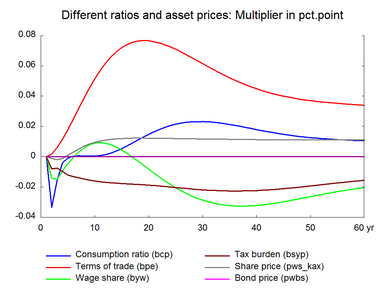
Instead of investments in buildings, public investments in machinery can be increased to boost economic activity. The short-term expansionary effect is smaller due to the higher import content of machinery. Government investment in machinery is increased permanently by 0.1 percent of GDP in 2010 prices. (See experiment)
Table 4. The effect of a permanent increase in public investment in machinery
| 1. yr | 2. yr | 3. yr | 4. yr | 5. yr | 10. yr | 15. yr | 20. yr | 25. yr | 30. yr | ||
| Million 2010-Dkr. | |||||||||||
| Priv. consumption | fCp | 38 | 312 | 465 | 540 | 595 | 811 | 1056 | 1251 | 1333 | 1319 |
| Pub. consumption | fCo | 0 | 243 | 484 | 699 | 893 | 1602 | 2018 | 2263 | 2409 | 2497 |
| Investment | fI | 2532 | 2846 | 2654 | 2538 | 2512 | 2344 | 2251 | 2223 | 2199 | 2167 |
| Export | fE | -39 | -90 | -163 | -257 | -371 | -1146 | -1938 | -2470 | -2693 | -2683 |
| Import | fM | 1311 | 1510 | 1451 | 1409 | 1416 | 1355 | 1266 | 1191 | 1131 | 1097 |
| GDP | fY | 1219 | 1819 | 2010 | 2142 | 2252 | 2343 | 2246 | 2228 | 2284 | 2377 |
| 1000 Persons | |||||||||||
| Employment | Q | 0,84 | 1,36 | 1,55 | 1,62 | 1,62 | 0,96 | 0,17 | -0,28 | -0,43 | -0,41 |
| Unemployment | Ul | -0,45 | -0,71 | -0,79 | -0,82 | -0,81 | -0,48 | -0,08 | 0,14 | 0,22 | 0,20 |
| Percent of GDP | |||||||||||
| Pub. budget balance | Tfn_o/Y | -0,08 | -0,07 | -0,07 | -0,08 | -0,08 | -0,12 | -0,16 | -0,18 | -0,19 | -0,20 |
| Priv. saving surplus | Tfn_hc/Y | 0,01 | -0,02 | -0,02 | -0,01 | -0,01 | 0,00 | 0,00 | 0,00 | 0,00 | 0,00 |
| Balance of payments | Enl/Y | -0,07 | -0,09 | -0,09 | -0,09 | -0,10 | -0,12 | -0,15 | -0,18 | -0,20 | -0,21 |
| Foreign receivables | Wnnb_e/Y | -0,11 | -0,23 | -0,34 | -0,45 | -0,55 | -1,08 | -1,61 | -2,16 | -2,70 | -3,21 |
| Bond debt | Wbd_os_z/Y | 0,06 | 0,11 | 0,17 | 0,23 | 0,29 | 0,69 | 1,20 | 1,73 | 2,25 | 2,74 |
| Percent | |||||||||||
| Capital intensity | fKn/fX | -0,03 | -0,01 | 0,02 | 0,04 | 0,07 | 0,16 | 0,21 | 0,23 | 0,23 | 0,22 |
| Labour intensity | hq/fX | -0,03 | -0,04 | -0,04 | -0,04 | -0,04 | -0,04 | -0,05 | -0,05 | -0,05 | -0,05 |
| User cost | uim | 0,07 | 0,17 | 0,26 | 0,34 | 0,41 | 0,65 | 0,76 | 0,78 | 0,76 | 0,72 |
| Wage | lna | 0,01 | 0,03 | 0,06 | 0,08 | 0,11 | 0,24 | 0,29 | 0,28 | 0,25 | 0,21 |
| Consumption price | pcp | 0,00 | 0,01 | 0,02 | 0,03 | 0,04 | 0,09 | 0,13 | 0,14 | 0,13 | 0,12 |
| Terms of trade | bpe | 0,00 | 0,01 | 0,01 | 0,02 | 0,02 | 0,06 | 0,07 | 0,08 | 0,07 | 0,06 |
| Percentage-point | |||||||||||
| Consumption ratio | bcp | -0,03 | -0,02 | 0,00 | 0,00 | 0,00 | 0,00 | 0,01 | 0,02 | 0,02 | 0,02 |
| Wage share | byw | -0,01 | -0,01 | -0,01 | 0,00 | 0,00 | 0,01 | 0,00 | -0,01 | -0,02 | -0,03 |
Like building investments, machinery investments have expansionary effects on the economy in the short run. In the long run, the effect on unemployment is zero due to the wage-driven crowding out.▼ The wage relation in ADAM is a Phillips curve, which links the changes in wages to unemployment. A fall/rise in unemployment pushes wages and hence prices upward/downward and reduces/improves competitiveness. So exports and production decrease/increase and over time unemployment returns to its baseline. This is the wage-driven crowding out process. The short-term employment effect of machinery investments is smaller because the import content of machinery investments is higher than that of building investments. The smaller domestic activity effect implies that the pressure on wages and prices is also smaller. The resulting real wage effect on consumption is also smaller.▼ Real wage effect arises because wages increase/decrease more than the general price levels due to the deadweight from the non-responding exogenous import prices. This creates a positive/negative real wage effect and real disposable income and private consumption increase/decrease permanently.
It is also worth noting that the accelerator effect on total investment is smaller when investing in machines than when investing in buildings. This is because machines are used for a shorter time periods and the ratio between the stock of machinery and investment is smaller.▼ The accelerator effect is when an increase in production results in a proportionately larger rise in investment. An ‘x’ percent increase in production requires an ‘x’ percent increase in capital. Since capital stock is larger than annual investment, ‘x’ percent increase in capital requires a more than ‘x’ percent increase in investment.
Note that the smaller impact on domestic production and income implies a stronger deterioration of public budget in the short run than when public building investments or the public purchase of goods and services increase. This is, however, not evident from the tables above because the public demand shocks are made comparable in fixed prices, i.e. all shocks are calibrated to have an impact of 0.1 percent of GDP in 2010 prices on the public budget in the first year.▼ The immediate impact on public budget is the largest in the present experiment because the price deflator of machinery is the smallest, due to, among others, the falling computer prices. Hence, when calibrating the demand shocks to have the same immediate impact in current prices, machinery investments in fixed prices need to increase by proportionately larger amount to compensate for the smaller prices and this will create the largest impact on public budget in the immediate run. It should also be noted that the modest accompanying increase in government consumption reflects that the higher government stock of capital triggers an increase in depreciation, which is part of government consumption.
The four demand experiments discussed so far have similar effects on the domestic economy but differ in terms of the magnitude of the impact. An increase in government employment has the largest immediate impact on the domestic economy as it has no direct link to imports. An increase in government investment in machinery has the smallest impact on the domestic economy as the import content is high. Similarly, the long-term impact on government budget is the highest in the former and the smallest in the latter.
All the experiments are considered without funding and the public budget balance deteriorates permanently. The public expenditure can be financed by reducing other public expenditures or by increasing revenues. Section 18 below demonstrates financing the public purchase of goods and services by raising income taxes. If income taxes are raised to finance public expenditures the positive effect on private consumption will turn negative as real disposable income permanently falls, consequently competitiveness will not necessarily deteriorate.
Figure 4. The effect of a permanent increase in public investment in machinery
