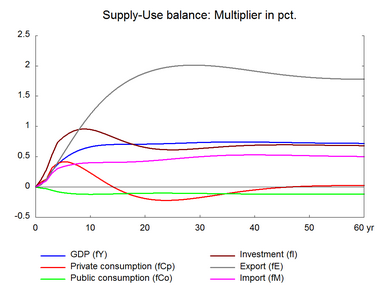
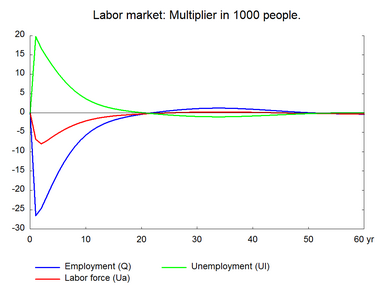
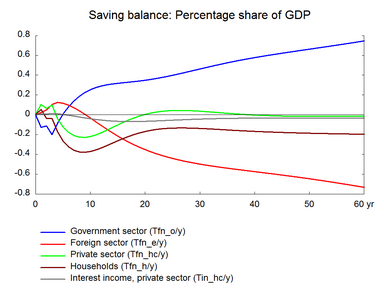
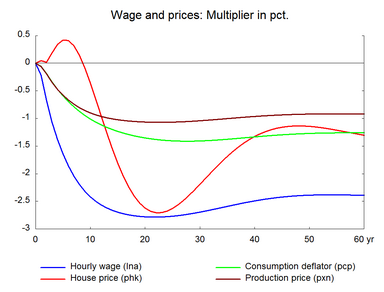
The supply of labor input will also increase if working hours increase. An increase in working hours raises employment in terms of hours and in the short run it reduces the number of workers employed. Table 11 presents the effect of a permanent 1 per cent increase in working hours. (See experiment)
Table 11. The effect of a permanent increase in working hours
| 1. yr | 2. yr | 3. yr | 4. yr | 5. yr | 10. yr | 15. yr | 20. yr | 25. yr | 30. yr | ||
| Million 2005-kr. | |||||||||||
| Priv. consumption | fCp | 614 | 1031 | 2539 | 3196 | 3448 | 2082 | -356 | -1967 | -2431 | -2084 |
| Pub. consumption | fCo | -64 | -104 | -210 | -301 | -368 | -512 | -513 | -506 | -540 | -608 |
| Investment | fI | 362 | 892 | 1665 | 2341 | 2664 | 3346 | 3015 | 2680 | 2716 | 3028 |
| Export | fE | 280 | 1033 | 2053 | 3193 | 4394 | 10422 | 15284 | 18846 | 21418 | 23245 |
| Import | fM | 409 | 822 | 1833 | 2474 | 2774 | 3590 | 3933 | 4424 | 5178 | 6022 |
| GDP | fY | 754 | 1924 | 4018 | 5650 | 6946 | 10935 | 12493 | 13516 | 14773 | 16240 |
| 1000 Persons | |||||||||||
| Employment | Q | -26.56 | -24.65 | -21.52 | -18.38 | -15.51 | -5.74 | -1.87 | -0.35 | 0.56 | 1.12 |
| Unemployment | Ul | 19.74 | 16.66 | 14.35 | 12.21 | 10.27 | 3.68 | 1.10 | 0.08 | -0.53 | -0.91 |
| Percent of GDP | |||||||||||
| Pub. budget balance | Tfn_o/Y | -0.13 | -0.11 | -0.20 | -0.09 | 0.01 | 0.25 | 0.32 | 0.35 | 0.40 | 0.46 |
| Priv. saving surplus | Tfn_hc/Y | 0.10 | 0.06 | 0.10 | -0.04 | -0.12 | -0.22 | -0.10 | 0.00 | 0.04 | 0.04 |
| Balance of payments | Enl/Y | -0.02 | -0.05 | -0.10 | -0.12 | -0.12 | 0.03 | 0.22 | 0.35 | 0.44 | 0.50 |
| Foreign receivables | Wnnb_e/Y | -0.03 | -0.07 | -0.16 | -0.26 | -0.35 | -0.42 | 0.34 | 1.70 | 3.33 | 5.01 |
| Bond debt | Wbd_os_z/Y | 0.14 | 0.30 | 0.51 | 0.61 | 0.62 | -0.14 | -1.35 | -2.55 | -3.75 | -5.03 |
| Percent | |||||||||||
| Capital intensity | fKn/fX | -0.05 | -0.14 | -0.26 | -0.35 | -0.41 | -0.52 | -0.50 | -0.49 | -0.51 | -0.52 |
| Labour intensity | hq/fX | -0.02 | -0.05 | -0.08 | -0.09 | -0.09 | -0.04 | -0.01 | 0.01 | 0.02 | 0.03 |
| User cost | uim | -0.05 | -0.16 | -0.29 | -0.40 | -0.49 | -0.76 | -0.88 | -0.92 | -0.93 | -0.91 |
| Wage | lna | -0.22 | -0.67 | -1.07 | -1.38 | -1.64 | -2.42 | -2.70 | -2.78 | -2.77 | -2.69 |
| Consumption price | pcp | -0.06 | -0.19 | -0.34 | -0.47 | -0.59 | -1.01 | -1.23 | -1.35 | -1.40 | -1.41 |
| Terms of trade | bpe | -0.05 | -0.15 | -0.28 | -0.38 | -0.47 | -0.73 | -0.83 | -0.87 | -0.87 | -0.85 |
| Percentage-point | |||||||||||
| Consumption ratio | bcp | -0.10 | -0.09 | -0.13 | -0.01 | 0.06 | 0.10 | -0.06 | -0.19 | -0.23 | -0.23 |
| Wage ratio | byw | -0.08 | -0.22 | -0.31 | -0.36 | -0.40 | -0.44 | -0.42 | -0.40 | -0.36 | -0.33 |
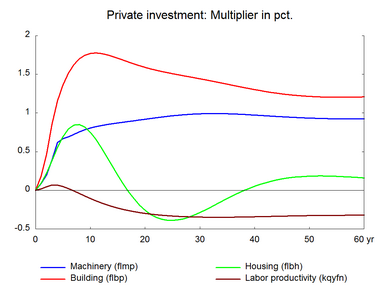
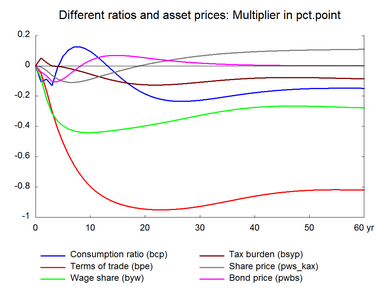
When working hours of existing workers increase potential production increases immediately. Compared to the previous experiment the first round reaction via the production function is stronger in the present experiment because the working hours of already employed people increases. In the short run, there is no change in demand, so layoffs are inevitable and employment falls. The rise in unemployment dampens wages and competitiveness improves. Consequently, exports increase and gradually unemployment falls and returns to the baseline.
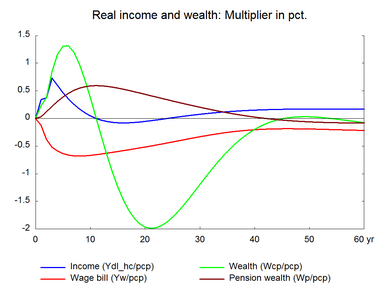
Recall that private consumption falls when the shock to labor input is in number of workers. When the number of workers increase, both real wages and annual earnings fall. As a result there will be a negative impact on real disposable income and private consumption. Here, there is no effect on private consumption in the long run. Real wages fall more than the increase in working hours, so that the fall in real annual earnings is small. As real profits increase, real disposable income remains unchanged and the long term effect on private consumption will be zero.
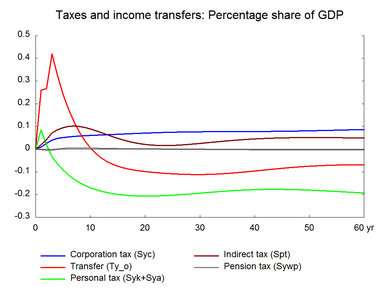
There is a positive effect on the public budget. This is because the fall in public expenses is larger than the fall in revenues. Personal income taxes does not fall as much as annual income as increasing working hour offsets the fall. At the same time corporate taxes increase due to the increase in profits. Indirect taxes also contribute to revenue.
Der er en positiv effect på det offentlige budget. Effekten på det offentlige forbrug er et gennemsnit af effekten på timeløn og priser. Effekten på indkomstoverførslerne svarer til effekten på den private årsløn. Men reduktion i de offentlige indtægter er mindre; her giver
Figure 11. The effect of a permanent 1 per cent increase in working hours
